I know the quarter isn’t over yet but the markets are closed for the weekend so I figured I may as well take a look at all those fancy pants predictions I made back in January and see how I’ve been making out.
First off – it ain’t pretty. But I’m willing to man up and face the music so to speak if you’re willing to keep reading and receive all of my excuses. Warning: there will be many.
The best thing about a forecast of course is having people mercilessly mock where you dropped the ball so egregiously that it’s almost like you don’t have clue what you are talking about. Which is of course, in the case of many forecasters, pretty much a lock. For example, why am I opining on the price of oil? Do I buy oil? Do I have access to proprietary data that gives me some remarkable insight others don’t have? Of course not. I think the true art in forecasting is in having a sense of humour. You know you’re going to be wrong so own it with a smile, make your excuses and move on. It’s not like anyone is trading or investing or making business decisions off these forecasts, right? Right?? RIGHT?!?!?!?! Anyone? Bueller?
Fine, enough twittery, here we go.
Broad Themes
There were a few broad themes in the forecast that were designed to be easy to pick and less easy to critique.
First of these was a prediction that the popu-nationalism that gave rise to Trump and Brexit would in fact crest and fade over the year. So we had the Macron election and things seemed to stabilize and then, for some inexplicable reason, we can’t seem to shake it. An election in Germany that should have been a cakewalk suddenly gave us a resurgent right wing, an independence referendum in Kurdistan was overwhelmingly carried by the independence side, increasing tensions in the region. At the same time, we had the ugliness in Charlottesville with the Alt-right and Neo-Nazi rallies, the #takeaknee craziness in the NFL and the massive backlash against it and of course the war of words between the Rocket Man and the Dotard – sometimes I wish that the chair that Clint Eastwood yelled at in 2012 had won an election or two, the world might be a better place! One could be forgiven for thinking we had slit backwards in our progressive march forward until we was saved by Justin Trudeau at the UN and his adorable socks and, of all things, by Saudi Arabia finally allowing women to drive. Wow right? Not that they’re allowed to go anywhere by themselves, but they can now drive nowhere legally.
Trade is becoming something of a priority with the Trump administration as NAFTA renewal is now in its third round of talks before Trump rips it up.
The rapprochement with Russia is still a work in progress. Ironically that rapprochement is between Russia and Saudi Arabia, which is weird, since they are on opposite sides in Syria and other places but partners in oil production cuts. I guess cash trumps military interventionism?
Turkey was my global flashpoint given its historic position as the intersection of cultures. But so far it has been North Korea stealing the show. Who knew the Hermit Kingdom would dominate so much of the conversation what with all those missiles and nuclear tests. That said, Turkey has a Kurdish problem and the prospect of an independent Kurdistan on its border is a big issue for them. So much so that they have threatened to shut down a critical oil pipeline, thereby accomplishing what OPEC couldn’t – a fear based rally in the price of oil – yay, right?
The final theme was the “cresting” of the green wave and how the Trump election was a disaster for the environmental movement. As noted before, this is certainly the case in the United States where the green movement is increasingly pushed off the front page and development continues apace. Here in Canada we have yet to figure out anything except how to get in our own way, but you’ve heard me on that already so no sense beating a dead horse.
Broad Theme Grade – B. Why? The year isn’t over yet.
Production
First call was that OPEC/NOPEC would meet their production cuts and indeed they continue to do so. Compliance is consistently high
Non-OPEC production was expected to be flat year over year so we will wait in that result. Recent data out of Brazil suggests that production may actually decline
With an initial prediction of the US adding only 300 to 400 thousand barrels a day of production in 2017, I was proved wrong quickly out of the gate. With some analysts calling for a 1.2 million barrel increase, I was definitely on the low side as the rig count grew aggressively. However the rig count has plateaued and getting production on stream has been a challenge. I had raised my top end to 600,000 barrels a day in March and think I should revisit that. Current YTD growth is about 800,000 barrels a day. My number is light, but 1.2 million? In three months? Could be tough. I do admit defeat on this one, the rig count recovered way faster than anticipated and I failed to account for sizable offshore additions to production. That’s a D verging on an F!
Canadian production was expected to post modest growth as well. At December 31 , 2016 Canadian production of crude and condensate was 4.156 million bpd and at September 28 it was projected to be 4.150 million bpd. However a lot of oilsands production was down in Q3, so the jury is out. Consensus has Canada growing by about 400,000 bpd this year. Based solely on the data, this will be hard to hit, the grade is a C.
Price of oil
So, as part of my new full-disclosure package, I adjusted my oil price forecast on the fly and am now targeting a year end price of $56 instead of $65 and a trading range between $45 and $55. I didn’t pick an average price, but I suppose if I have to, I am going to say $48.97.
Then of course the last week happened and we know what that means…
As of September 30, the price of oil was $51.67 and the average price for the year to date was $49.96. The period high was $54.45 and the low was $42.53. Grade B for the first 9 months. Otherwise pending. I am happy with where things are at.
Price of Natural Gas
I am probably the only person in North America who believes we are soon going to see a modest rise in gas prices in what some people will call a blip, but that I will call a rally, just because I like the term.
My prediction that gas would be a key commodity this year is looking, well, about as smart as a bag of hammers but I still believe in the gas story long term. Plus, something feels off about the injection season, it just wasn’t as robust as one would think. Something is afoot and I need to get to the bottom of it. I will say, if you like stability and predictability in your commodity price, this seems to be the place to be with prices seemingly unable to break free of that $3 mark.
My year end prediction was $4.50, which “in theory” could still happen, although as a theory it isn’t receiving a whole heck of a lot of peer review. My average price of $3.50 can in theory happen as well, like if something catastrophic happened to supply. But low gas prices this far into the year will make it hard to get to where I predicted. But supply feels tight. Come on people – heat your damn homes!
I did not revise my forecast so I have to stick with what I picked. So be it!
Price at the end of September was $3.007 and the average for the period was $3.1018. But gas traded as low as $2.50, in the winter. And that is a problem.
Grade is a C because we are holding north of $3, but I can pretty much guarantee year end won’t be close to my forecast.
Production
I predicted a robust 2017 in Canada with activity concentrated in a barbell fashion – Montney/Duvernay/Viking and then quiet all the way to the Bakken with the activity happening in Q1 2017 and resuming later in the summer. The first quarter was bang on and these areas were super busy. My prediction was based on number of wells so still too early to tell. But given current levels of activity are way ahead of last year and CAPP, PSAC and CAODC are all revising their projections upward, I’m thinking we are looking OK. Plus the summer unfolded as expected and the fall is shaping up busier, so yeah. Not bad.
US activity was expected to show quite robust growth and, well, Permania. Need I say more. In fact, I would say that I underestimated this drilling activity by probably 100 to 200 rigs back at work. I did not preduct the current plateau in rig counts, but then my commodity forecast was a bit more aggressive. Expect some rigs to come back based on the forward curve, but not as smartly as earlier in the year – capital and materials are scarcer, producers will be DUC hunting instead.
Grade B+. Directionally right for North America, close for Canada, underestimated the US.
M&A Activity
I predicted for the year that M&A activity would pick up, definitely in the service sector and to a lesser extent in the E&P world until later in the year when I expected a rebound.
Returns so far are spotty, a flurry of deals early on and then a quiet summer. It feels like there is a lot of pent up demand. I am curious how things will shake out as companies prepare for 2018.
Grade – C. Right call on service, whiff on E&P, so far.
Canadian Dollar
My call was for the dollar to trade around 75 cents for much of the year – held back by lower oil prices and US Fed rate hikes. Then the Bank of Canada happened and the economy grew and oil came back and what do you know – $0.81 cents just in time for my US vacation – woot! While I expect the dollar to lose some strength over the next quarter, I did say a rally in oil could bring us closer to 80 cents, and that that level was still possible by the end of the year, it’s just here earlier, so I’m going to pat myself on the back (pat pat).
Grade: A-. Because I was mostly right.
Infrastructure
I give up. Dear USA, when you invade Canada, I apologize for the lack of commodity export capacity.
Grade: Pending. May have withdrawn from the course.
Stock Picks
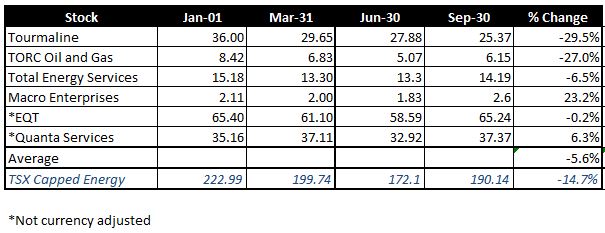
OK, energy and energy related stocks have been eviscerated for most of the year, but I’ve got some decent names, so how bad can it actually get?
OK, a loser, but not as bad as it could be. Overall the portfolio is down 5.6% but is ahead of its benchmark, which is down 14.7%. So outperformance – yay!

But some of these guys need to start pulling their weight – like Tourmaline? What up with that?
That said, for the quarter, the portfolio was up 14.3% and without Tourmaline that would have been closer to 16%. I say again – Tourmaline, you were my favourite – what happened????
Grade C – out performance, but still losing money
Overall Grade? I still can’t give it more than a C, no one aces the test by nailing the Canadian dollar (weak and occasionally strong!).
Prices as at September 29, 2017 (September 22, 2017)
- The price of oil continued to rise during the week as refineries came back online, inventory declined and risk – real risk! returned to the market
- Storage posted a modest decrease
- Production continued to recover from Harvey
- The rig count in the US appears to have plateaued
- Natural gas fell during the week on a supply build.
- WTI Crude: $51.67 ($50.65)
- Nymex Gas: $3.006 ($2.949)
- US/Canadian Dollar: $0.8025 ($ 0.8112)
Highlights
- As at September 22, 2017, US crude oil supplies were at 471.0 million barrels, a decrease of 1.8 million barrels from the previous week and 1.1 million barrels below last year.
- The number of days oil supply in storage was 31.5 ahead of last year’s 30.2.
- Production was up for the week by 37,000 barrels a day at 9.547 million barrels per day. Production last year at the same time was 8.497 million barrels per day. The change in production this week came from an increase in Alaska deliveries and recovering Lower 48 production.
- Imports rose from 7.368 million barrels a day to 7.427 compared to 7.835 million barrels per day last year.
- Exports from the US rose to 1.491 million barrels a day from 0.928 and 0.491 a year ago
- Canadian exports to the US were 3.497 million barrels a day, up from 3.105
- Refinery inputs were up during the week at 16.174 million barrels a day
- As at September 22, 2017, US natural gas in storage was 3.466 billion cubic feet (Bcf), which is 1% above the 5-year average and about 4% less than last year’s level, following an implied net injection of 58 Bcf during the report week.
- Overall U.S. natural gas consumption was up 6% during the week
- Production for the week was flat. Imports from Canada were up 1% compared to the week before. Exports to Mexico were up 4%.
- LNG exports totalled 18.5 Bcf.
- As of September 26 the Canadian rig count was 180 (28% utilization), 119 Alberta (28%), 26 BC (37%), 32 Saskatchewan (28%), 3 Manitoba (20%)). Utilization for the same period last year was just above 15%.
- US Onshore Oil rig count at September 29 was at 750, 6 more than the week prior.
- Peak rig count was October 10, 2014 at 1,609
- Natural gas rigs drilling in the United States was down 1 at 189.
- Peak rig count before the downturn was November 11, 2014 at 356 (note the actual peak gas rig count was 1,606 on August 29, 2008)
- Offshore rig count was up 2 at 19
- Offshore rig count at January 1, 2015 was 55
- US split of Oil vs Gas rigs is 80%/20%, in Canada the split is 56%/44%
Drillbits
- Cenovus Energy Inc. entered into an agreement to sell its Suffield crude oil and natural gas operations in southern Alberta to International Petroleum Corporation for gross cash proceeds of $512 million.
- Minnesota public hearings begin for Enbridge’s $6.5 bln oil pipe expansion
- It was a bad week for the TransMountain project as the NEB ordered it to stop some preparatory work until full approvals were given and the Federal Appeals court ruled that a small First Nation whose land the original right of way crosses got hosed by the Federal Government back in 1952 and that the Feds needed to pony up.
- Trump Watch: The tax plan was released. It’s a big and beautiful tax plan. And Puerto Rico was identified as an island. And no nuclear war – overall a winning week.


